Quick check module#
The circtools quickcheck module is designed to equip the user with a fast way of assessing the quality of the circRNA library preparation and the success of the mapping process.
circtools quickcheck requires sequencing reads have been mapped with STAR since internally the STAR log files are processed. CircRNA detection metrics are provided via circtools detect which has to be run prior to call the quickcheck module.
Required tools and packages#
quickcheck depends on R and two R packages, namely
ggplot2: general plotting
ggrepel: label assignment in plots
General usage#
A call to circtools quickcheck --help shows all available command line flags:
usage: circtools [-h] -d DETECT_DIR -s STAR_DIR -l CONDITION_LIST -g GROUPING
                 [-o OUTPUT_DIRECTORY] [-n OUTPUT_NAME] [-c {colour,bw}]
                 [-C CLEANUP] [-S STARFOLDER] [-L REMOVE_SUFFIX_CHARS]
                 [-F REMOVE_PREFIX_CHARS] [-R REMOVE_COLUMNS]

circular RNA sequencing library quality assessment

optional arguments:
  -h, --help            show this help message and exit

Required:
  -d DETECT_DIR, --detect DETECT_DIR
                        Path to the circtools detect data directory
  -s STAR_DIR, --star STAR_DIR
                        Path to the base STAR data directory containing sub-
                        folders with per-sample mappings
  -l CONDITION_LIST, --condition-list CONDITION_LIST
                        Comma-separated list of conditions which should be
                        comparedE.g. "RNaseR +","RNaseR -"
  -g GROUPING, --grouping GROUPING
                        Comma-separated list describing the relation of the
                        columns specified via -c to the sample names specified
                        via -l; e.g. -g 1,2 and -r 3 would assign sample1 to
                        each even column and sample 2 to each odd column

Output options:
  -o OUTPUT_DIRECTORY, --output-directory OUTPUT_DIRECTORY
                        The output directory for files created by circtools
                        [Default: ./]
  -n OUTPUT_NAME, --output-name OUTPUT_NAME
                        The output name for files created by circtools
                        [Default: quickcheck]
  -c {colour,bw}, --colour {colour,bw}
                        Can be set to bw to create grayscale graphs for
                        manuscripts
  -C CLEANUP, --cleanup CLEANUP
                        String to be removed from each sample name [Default:
                        "_STARmapping.*Chimeric.out.junction"]
  -S STARFOLDER, --starfolder STARFOLDER
                        Suffix string of the STAR folders[Default:
                        "_STARmapping"]
  -L REMOVE_SUFFIX_CHARS, --remove-last REMOVE_SUFFIX_CHARS
                        Remove last N characters from each column name of the
                        circtools detect input data [Default: 0]
  -F REMOVE_PREFIX_CHARS, --remove-first REMOVE_PREFIX_CHARS
                        Remove first N characters from each column name of the
                        circtools detect input data [Default: 0]
  -R REMOVE_COLUMNS, --remove-columns REMOVE_COLUMNS
                        Comma-separated list of columns in the circtools
                        detect data files to not includes in the check
Sample call#
circtools quickcheck -d 01_detect/ -s ../star -l minus,plus -g 1,2,1,2,1,2,1,2 -o 02_quickcheck/ -C .Chimeric.out.junction
Here we have the circtools data located in the folder 01_detect/, the STAR mapping are stored in star/, the experiment had 4 conditions, listed via -l RNaseR_minus,RNaseR_plus, the samples in the detection data file are sorted in the the order specified via -g 1,2,1,2,1,2,1,2.
Using R version 3.5.0 [/usr/bin/Rscript]
Loading CircRNACount
Loading LinearRNACount
Parsing data
Found 8 data columns in provided DCC data
2 different groups provided
Assuming (1,2),(1,2),(1,2),... sample grouping
plotting data
Done
circtools takes a few seconds to process the data.
Graphical output#
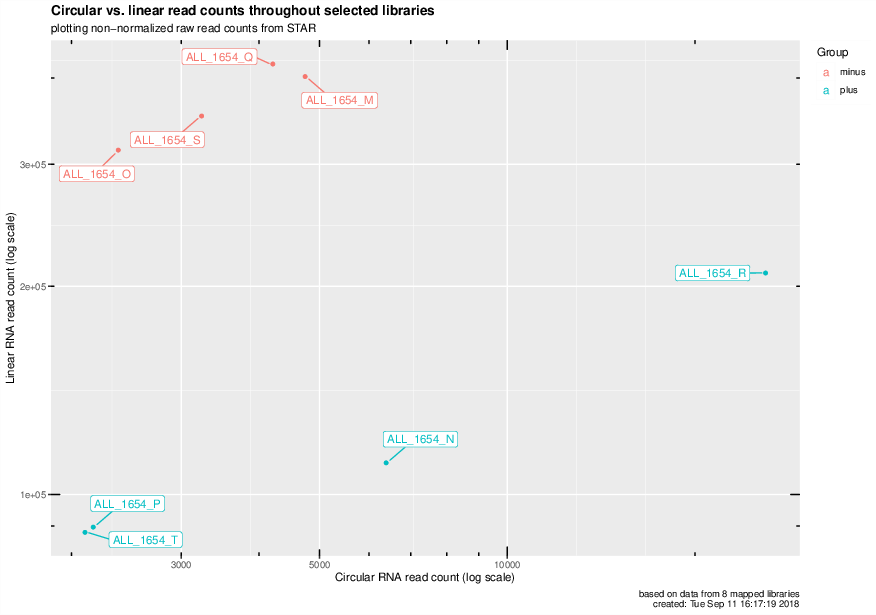
Circular vs. linear read counts for all mapped libraries#
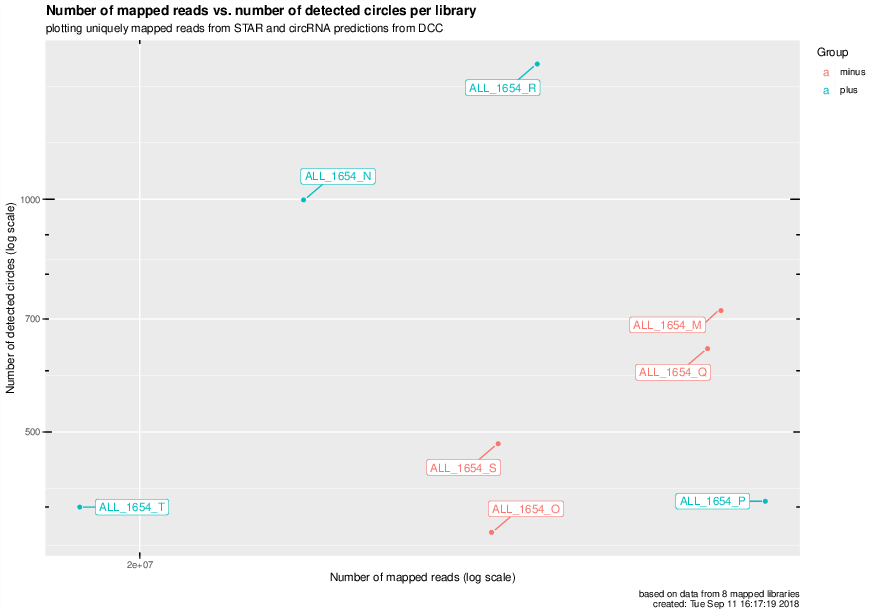
Number of mapped reads vs number of detected circRNAs for all mapped libraries#
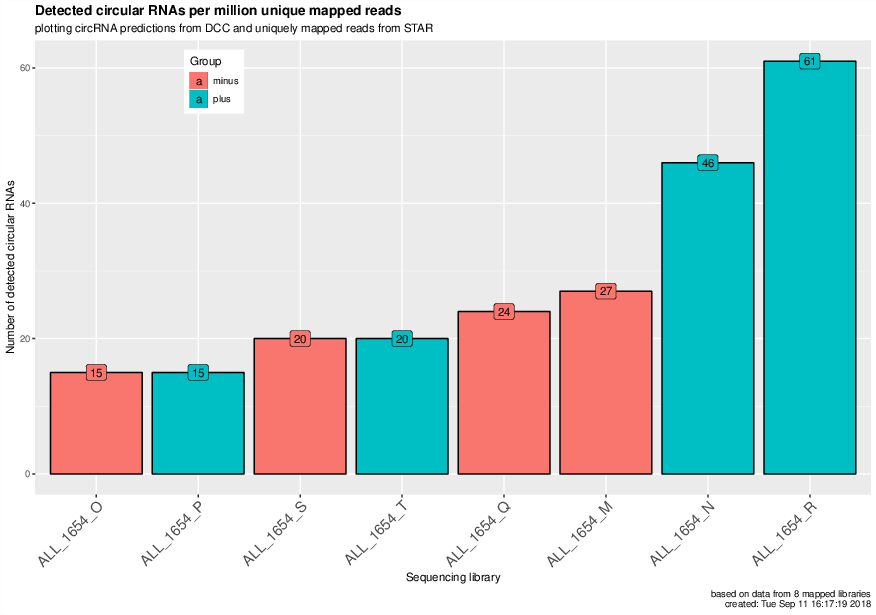
CircRNAs per million uniquely mapped reads#